How to measure the effectiveness of Smartsupp and conversions in the new Google Analytics 4? You will learn all that here. First of all - measuring Smartsupp in GA4 is a little bit harder than in Universal Analytics (the old ones), but don’t worry, it just takes a little bit of setup and you are good to go.
First start by going to this guide and setting up things in GA4 so you can evaluate it properly.
Create segments & audiences in GA4
The best way to start is to create a segment. This is sadly not possible in normal reports as was in Universal Analytics. You will have to use the new Explore tab for this, which is a little bit more complicated, but also more powerful. Here you can find the guide from Google on how to use the exploration tab. We will walk you all the way through creating this and using it as well. We also have 3 recommended segments and audiences, that we believe you should set up right away.
- In your Google Analytics go to the explore tab and then create a Blank report as in the screenshot below.

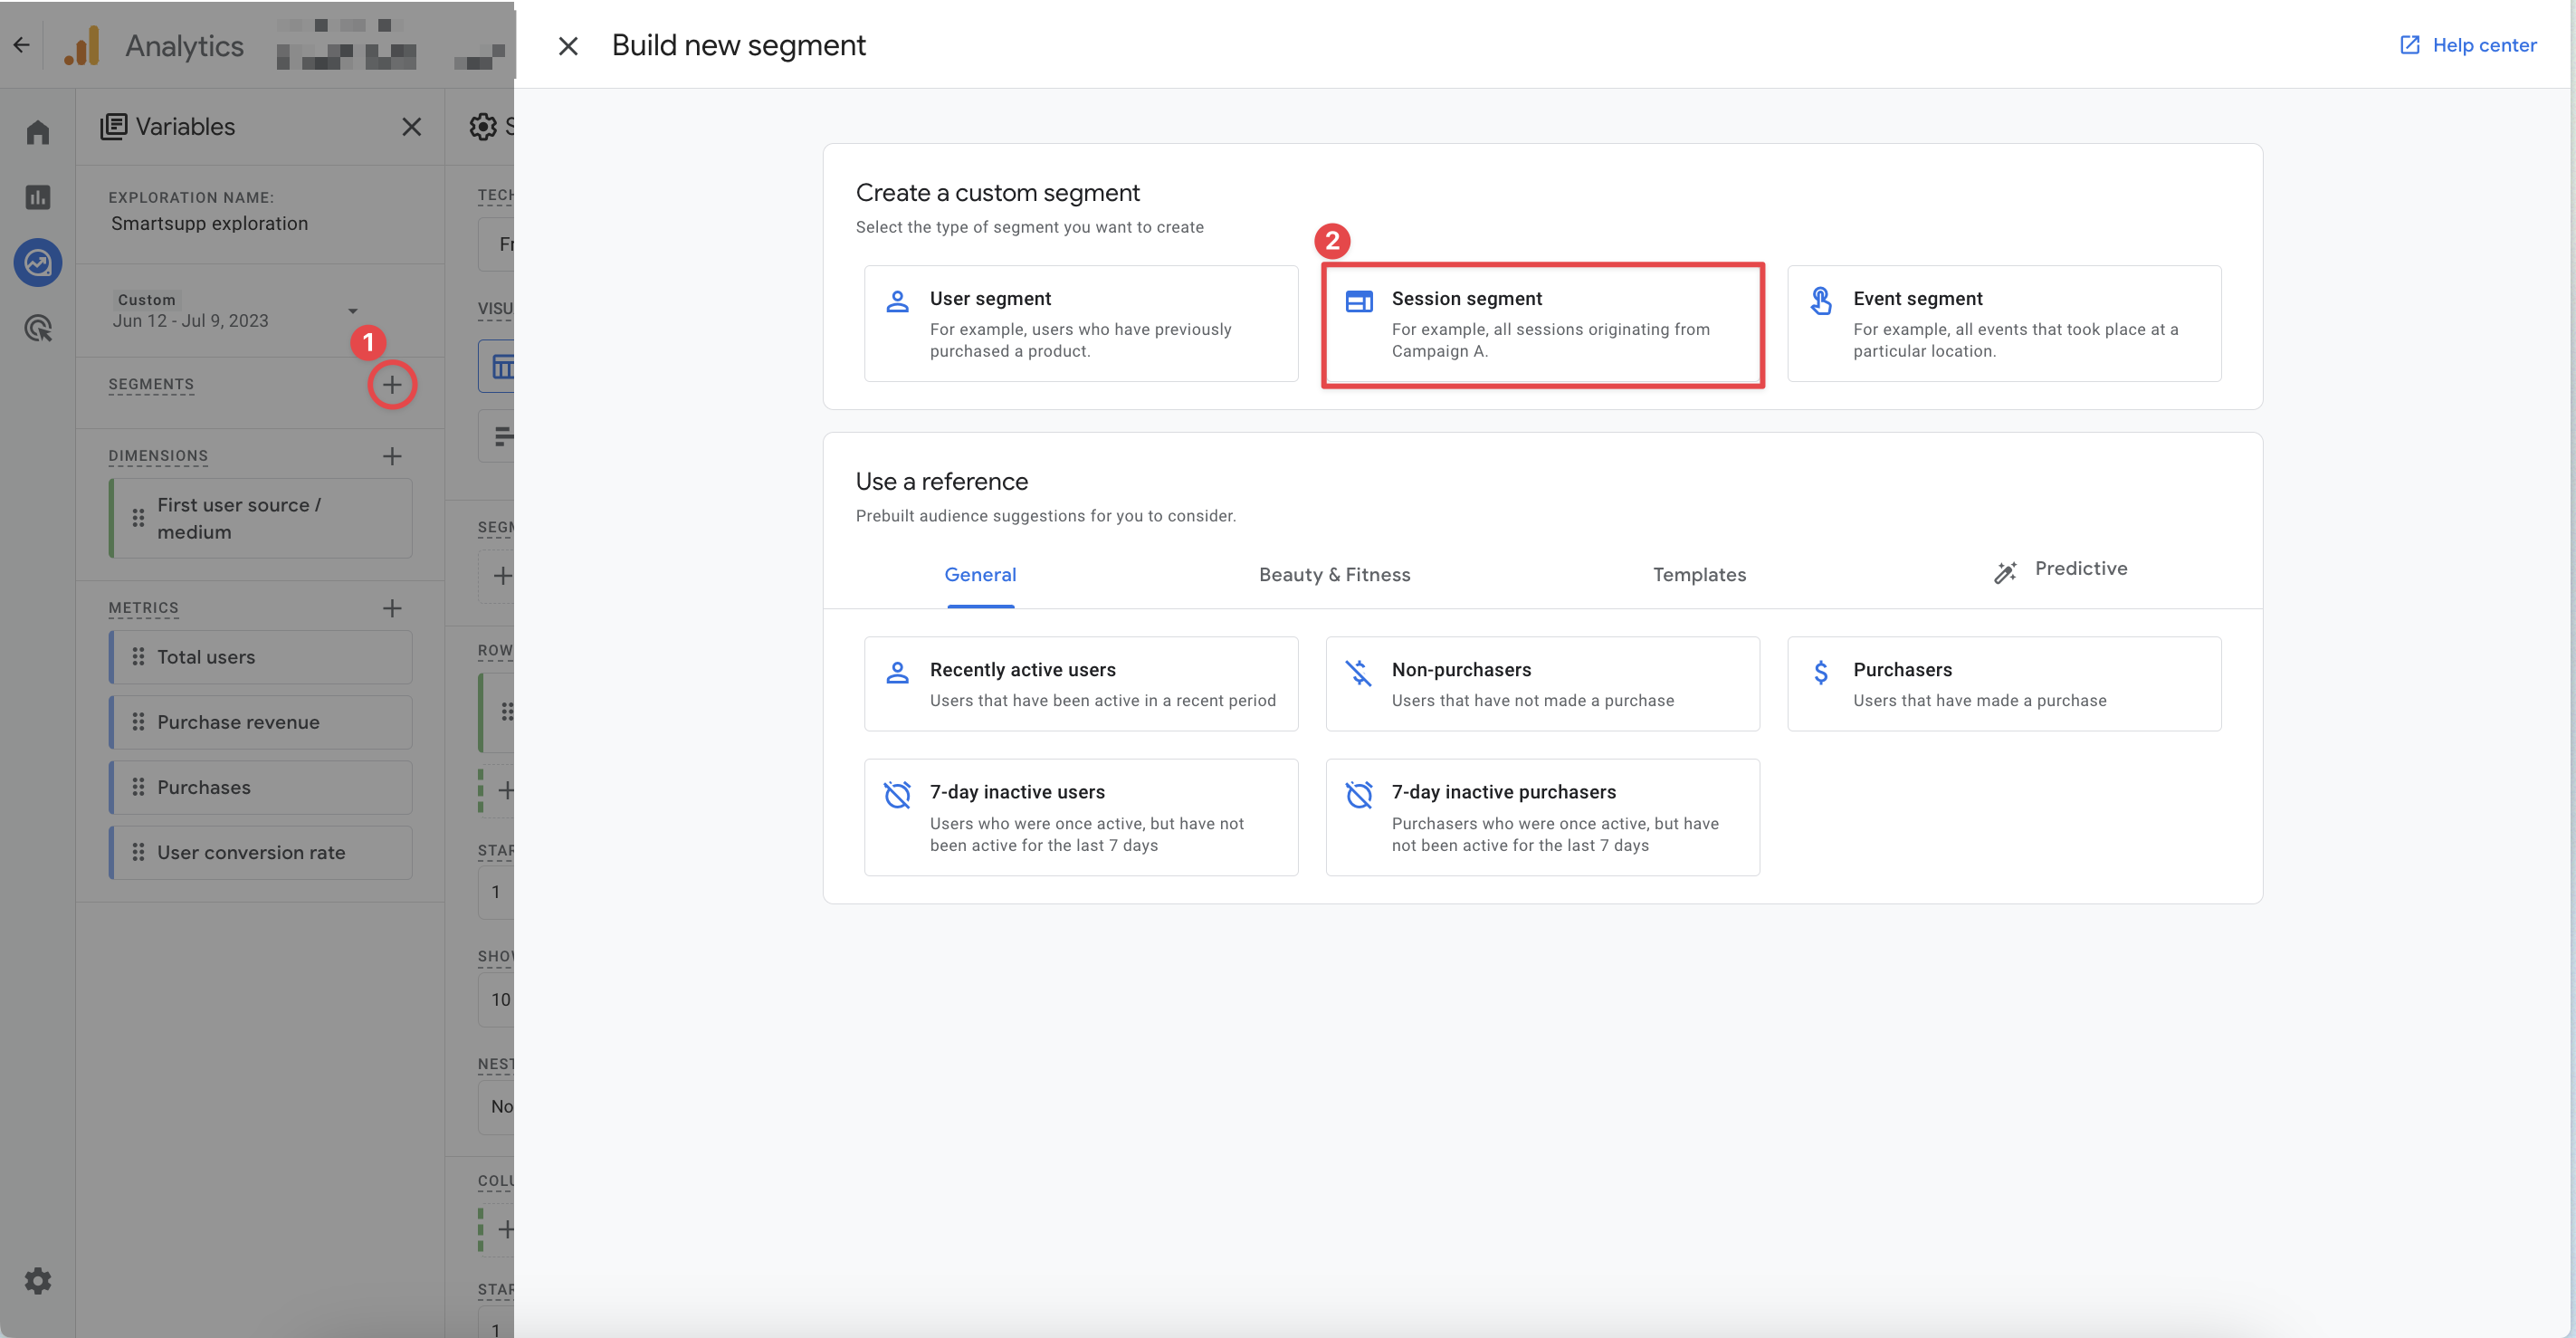
2. Then under segments you click on the plus button and select a Session segment. (you can also use user segment, but from our testing Session segments work better)

3. Name your segment whatever you like and then click on the browser icon in the top right.

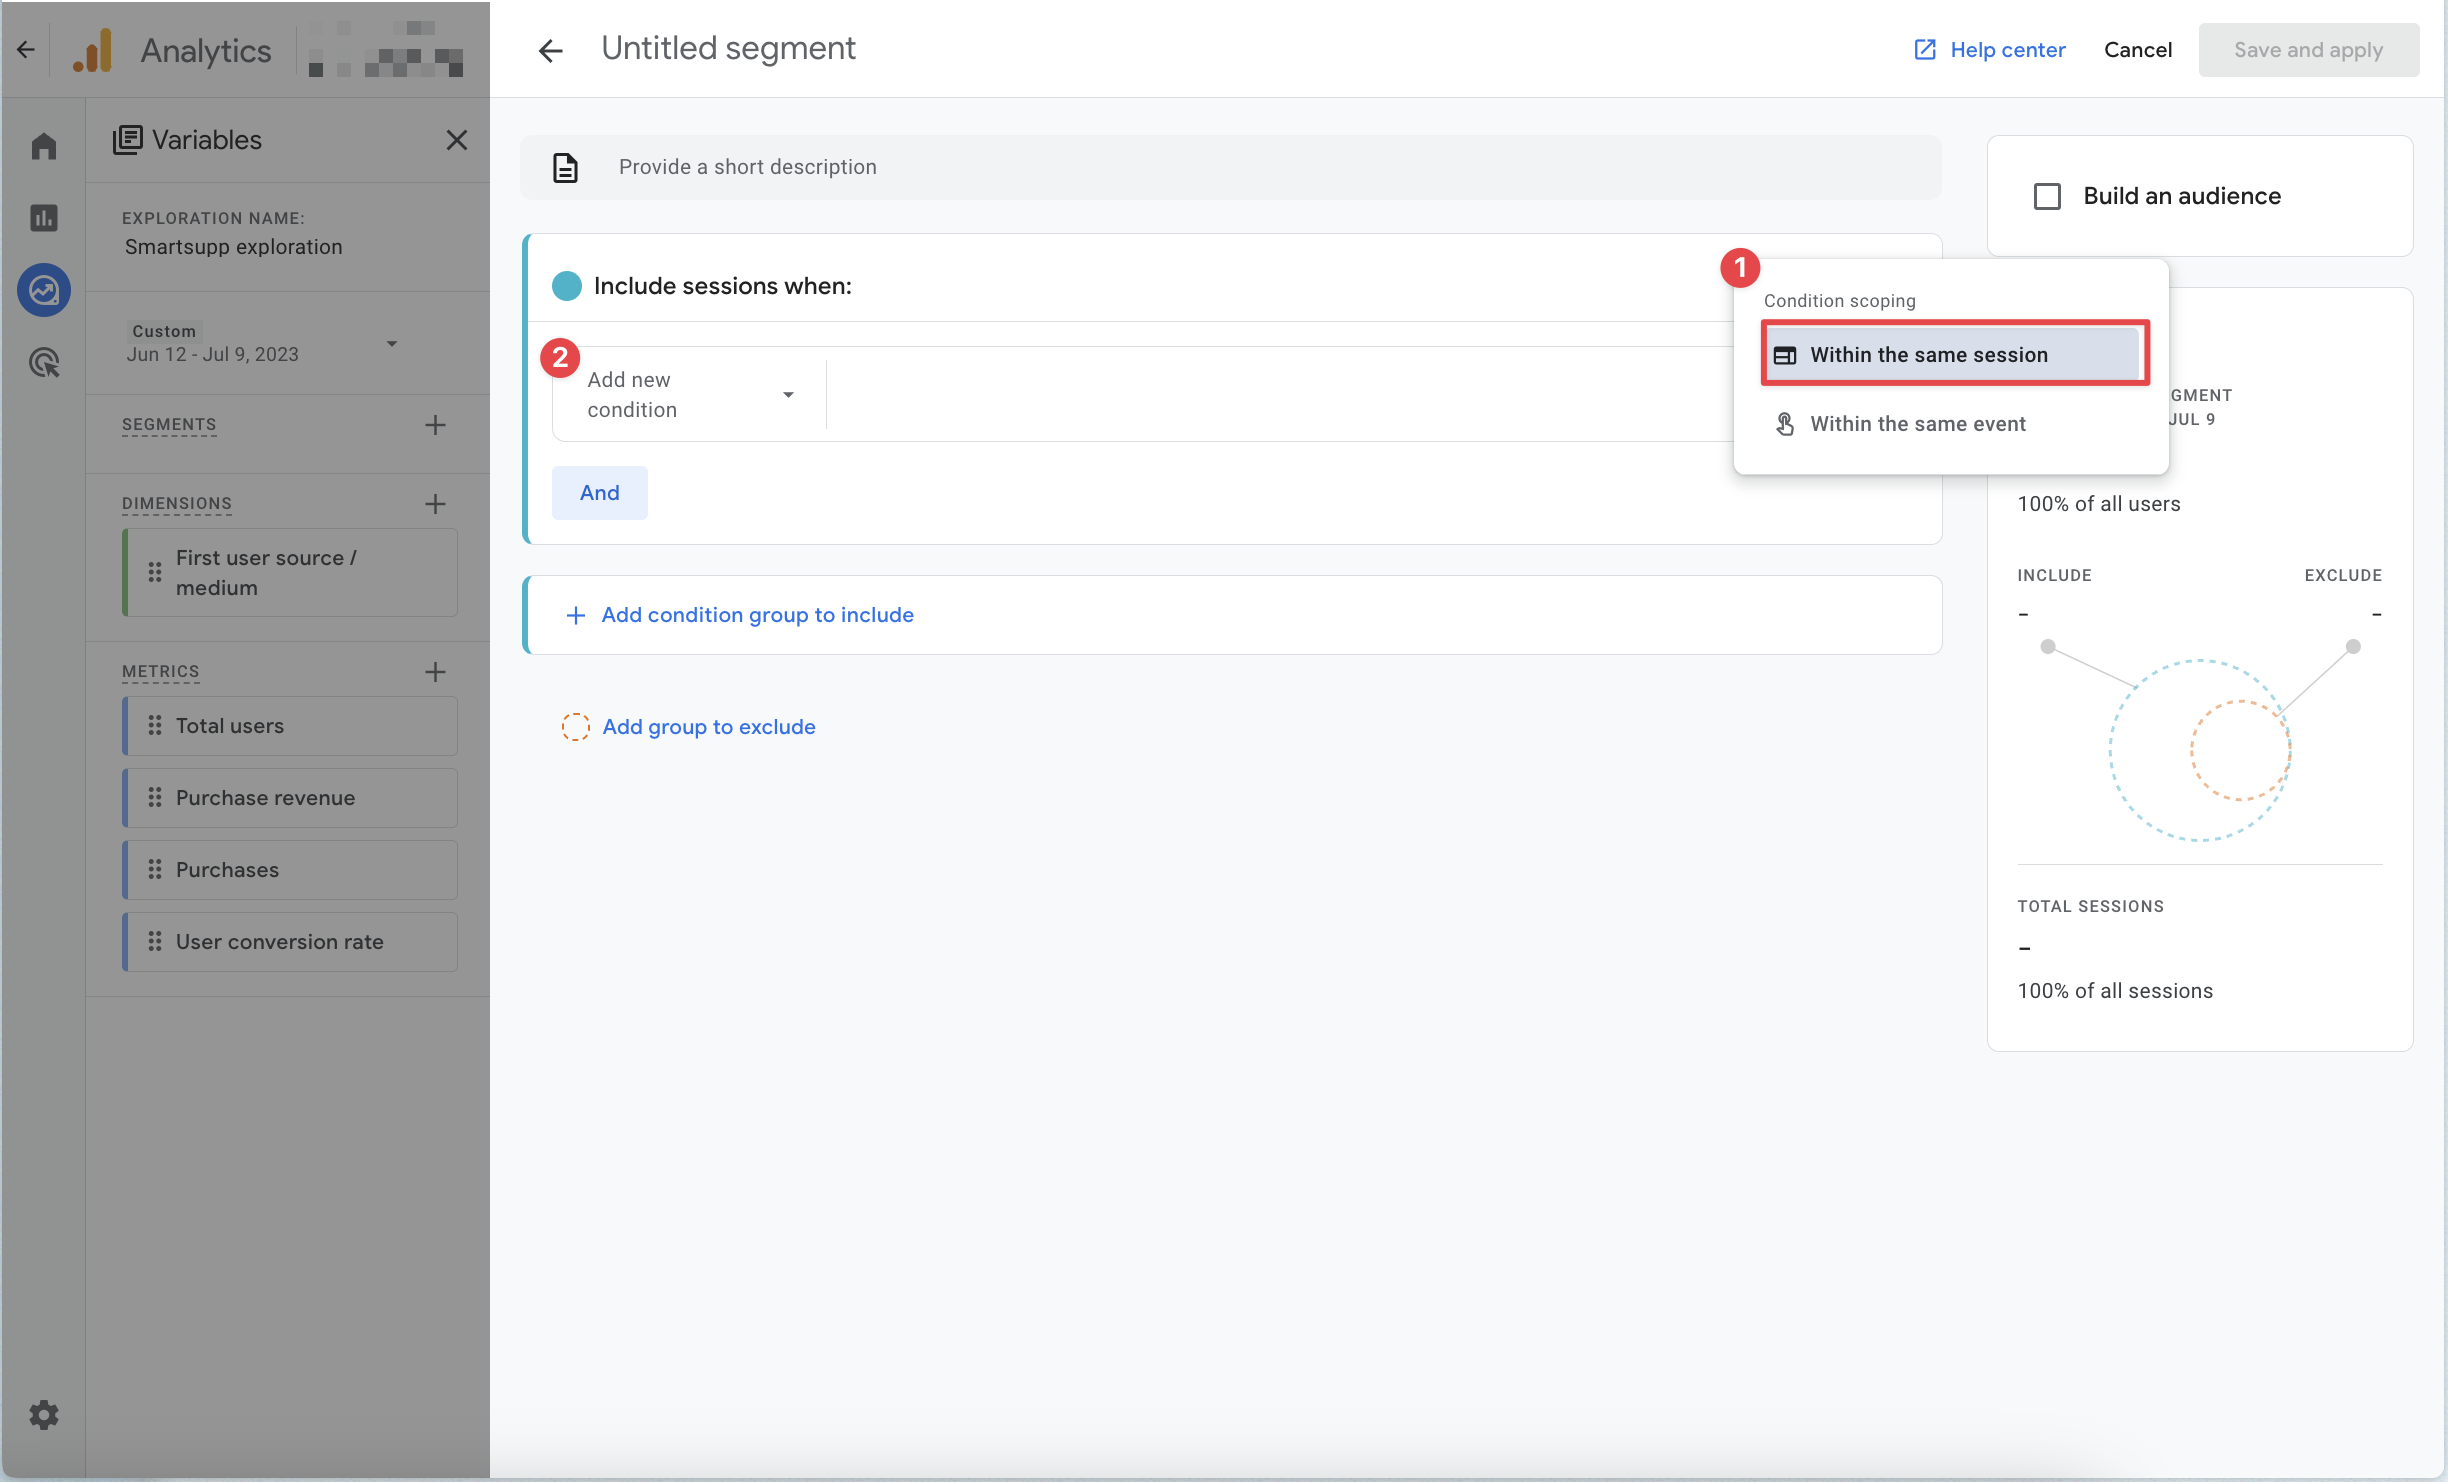
4. Here make sure that the condition scoping is set to Within the same session. The option within the same event won't work for this use case.
- Within the same session - GA4 will count every user that has fulfilled the set conditions within 1 session.
5. Go and add your conditions. Here you can choose event names and event dimensions. For evaluating Smartsupp we will be generally using event names. As you can see on the screenshot below we selected events Agent_served_conversation and Chatbot_interaction.
- Important - with Smartsupp segments we will be showing you always use the “Or” operator. This simply means that the person performed event_1 or event_2, whereas if you use AND operator the person must have performed both events within that session. Unless that is what you want, we recommend using OR.

6. Now click Build an audience - this is not necessary, but we strongly recommend it for the 3 segments we will show you below. Then click on Set to the maximum limit. After that, you will hit save and apply.
- Why create an audience? This will save your segment and you will be able to use it in standard reports in GA4. Mind that segment will show you data retrospectively, but audiences will be filled with data from the date of its creation + 30 days prior to the creation. More on audiences in this official google guide.

What segments do we recommend to create
We recommend creating 3 base segments for evaluating the Smartsupp effect. But feel free to create these, based on your own preferences and how you use Smartsupp.
Info: You can find all the events that Smartsupp sends with their description in this article
All Smartsupp interactions
This segment will segment out all users that have interacted with the Smartsupp chatbox in any way. So either with chatbots, agents, or auto messages.
You will add all these events as conditions:
- Chatbot_interaction
- Chatbot_visitor_reaction
- Auto_message_visitor_reaction
- Visitor_started_conversation
- Auth_form_filled
- Offline_message_sent
- Trigger_visitor_reaction
So let’s recap - you will create a new user segment.
- Name your segment
- Add all the conditions using “OR” operator
- Set the condition scoping to Within the same session
- Click on build audience - the audience name will be the same as the segment name
- Set to maximum limit
- Save and apply your segment

Interactions with chatbots
This audience will show you all the users who interacted with Smartsupp chatbots.
You will add these events as conditions:
- Chatbot_interaction
- Chatbot_visitor_reaction

All users segment
We also recommend adding the All users segment so you can compare easily. This is simply a user segment that has page_view event se as a condition. So this will give you all users, who performed the page_view event, so basically everybody.

Congratulations, you have all the basic segments. Please mind that these segments can and probably will overlap. The first segment will include all the users from the 2nd and 3rd segments. And 2nd and 3rd segments can overlap as well.
Evaluate Smartsupp
If you have gone through the tutorial from the beginning you now should see 3 segments under segments in your Exploration (red marked are in the screenshot below) Don’t forget to name your exploration (1) and set a date (2).

Smartsupp effect on conversions
Now you only see empty exploration. That is because you have not added any metrics and dimensions, so let’s do that.
- Add Metrics & Dimensions
Simply click the plus button in metrics and start typing whatever metrics you want to look at and add them to your report. Do the same for Dimensions.
As you can see in the screenshot below I simply added the First user source/medium as dimension and as metrics: Total users, Purchase revenue, Purchases, and User conversion rate.

2. Now simply drag n drop all the variables into your report:
- Segment Smartsupp all interactions to segments
- All the metrics into the values part
- Your dimension into rows part

In this report, you can easily see how Smartsupp contributes to your e-commerce revenue and how much it lifts the conversion rate. Here you see it broken down by the source/medium that the user first came in.
This is the simplest form of the report and you can play with it however you want. Add in the metrics you care about and add in the dimensions you want to slice your data by.

In this exploration, you can easily add more reports by clicking the plus button. You can for example create one report for all Smartsupp interactions, another one for chatbots, and last for your agent segment. Or you can drop all 3 segments into one report and see them side by side.
How to use audiences in a standard report
In the previous steps, we told you to create audiences from your segments. Now you will find out why is it helpful. In standard reports, you cannot use the same segments that you have in the exploration tab, but you can use the created audiences to compare.

- Go to Reports
- At the top click Add comparison
- On the right panel, choose the audience name
- And then choose one of the audiences you have created
- Click apply
Now you have a comparison that will show in all your standard reports.
Note that this method can have incomplete data as not users counted in the segment might be also added to the audience. It is much safer to evaluate in the explore tab than in the standard reports. The standard reports might in some cases show you very little data, mainly because the audience does not have enough data inside it.