
Statistics are available only in SOLO, PLUS and EXPERT packages (Legacy: STANDARD, PRO). Statistics are visible only to operators with full access and account owners.
Do you want to track how your customer support is performing and continuously improve your services? Statistics is the feature to go for. As a manager, you can set goals for your operators and check whether they are meeting them, or identify areas where they can improve.
Where can I find statistics?
You can access statistics from your dashboard by clicking on the separate tab with the chart icon. You will only see it as an account owner or when you have full access to the account.
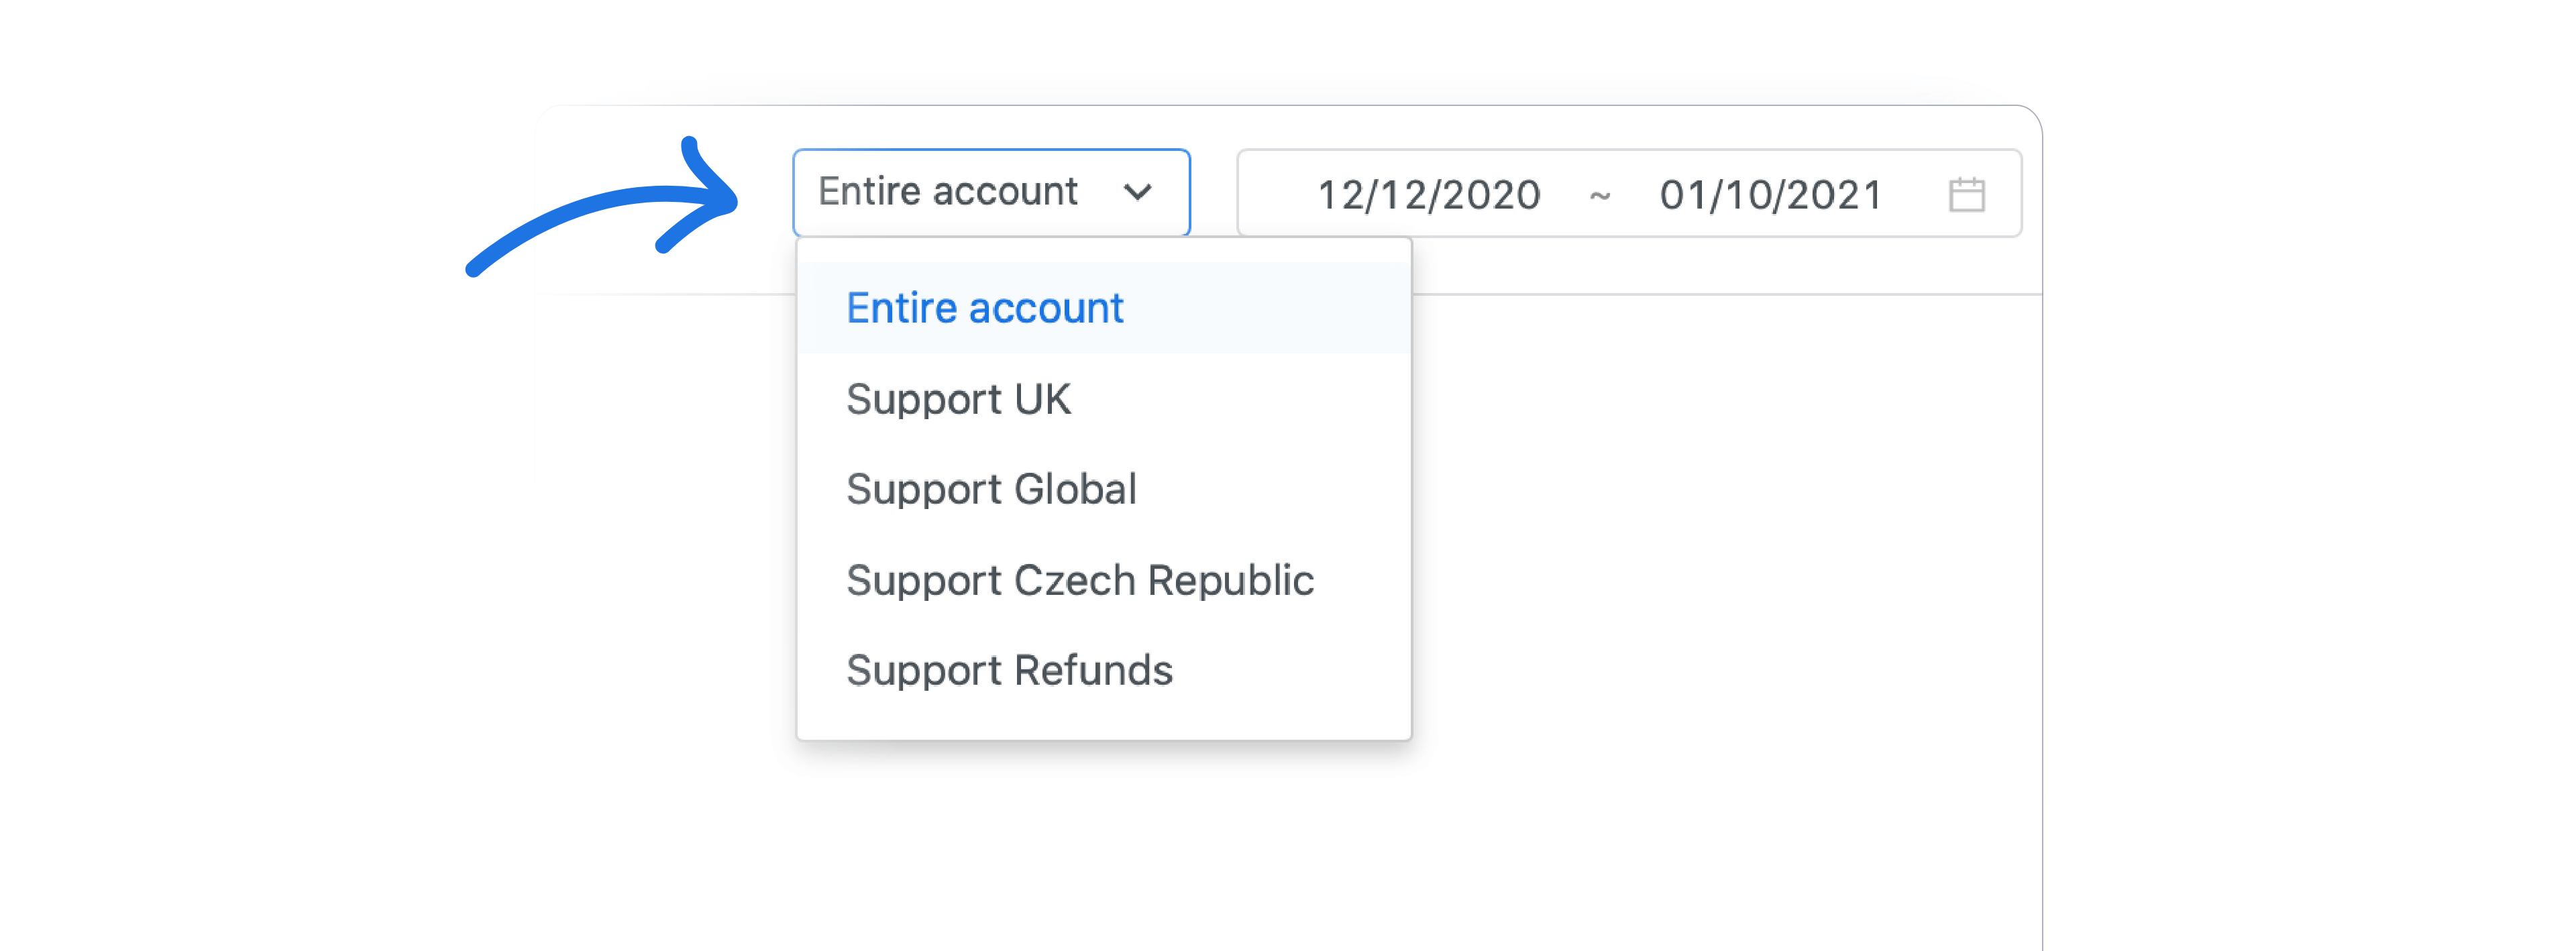
If you are using Groups from the EXPERT (Legacy: PRO) package, you will be able to select a group in the upper right part of the page. This way you can easily get analytical data about a specific team.
Conversation statistics
All statistics related to conversations can be found in the first section.
1. New conversations

In this tab you will find a chart that shows how many messages on chat you received during the selected time period. The time period can always be selected in the upper right part of the chart.
2. Answered conversations
In this tab you will find a chart that shows how many conversations you answered during the selected time period. The time period can always be selected in the upper right part of the chart.
3. Closed conversations
In this tab you will find a chart that shows how many conversations you marked as resolved during the selected time period. The time period can always be selected in the upper right part of the chart.
4. Average conversation rating
Find out how satisfied users are with you or your operators overall. On the left side you will find the overall average rating, below it the specific counts of positive, neutral and negative cases. The arithmetic mean is used for the calculation.
In the chart on the right side, you can choose different time periods, and the data will be reflected in the chart accordingly. This way you can easily see weaker or stronger days (e.g. during the pre-Christmas period) or satisfaction in season and off-season (in the monthly chart).
5. Response time

If you want to know how quickly operators respond to new conversations and individual messages, you will appreciate all the values in one clear chart. We use the median for the calculation.
The shorter the response time, the better the rating. You can achieve shorter times by using shortcuts and proper conversation management. Since email response times are also included in the reaction times, the value may range in hours or even days.

Operator statistics
If you want to know how individual operators are performing, you will find all the necessary information in this section.

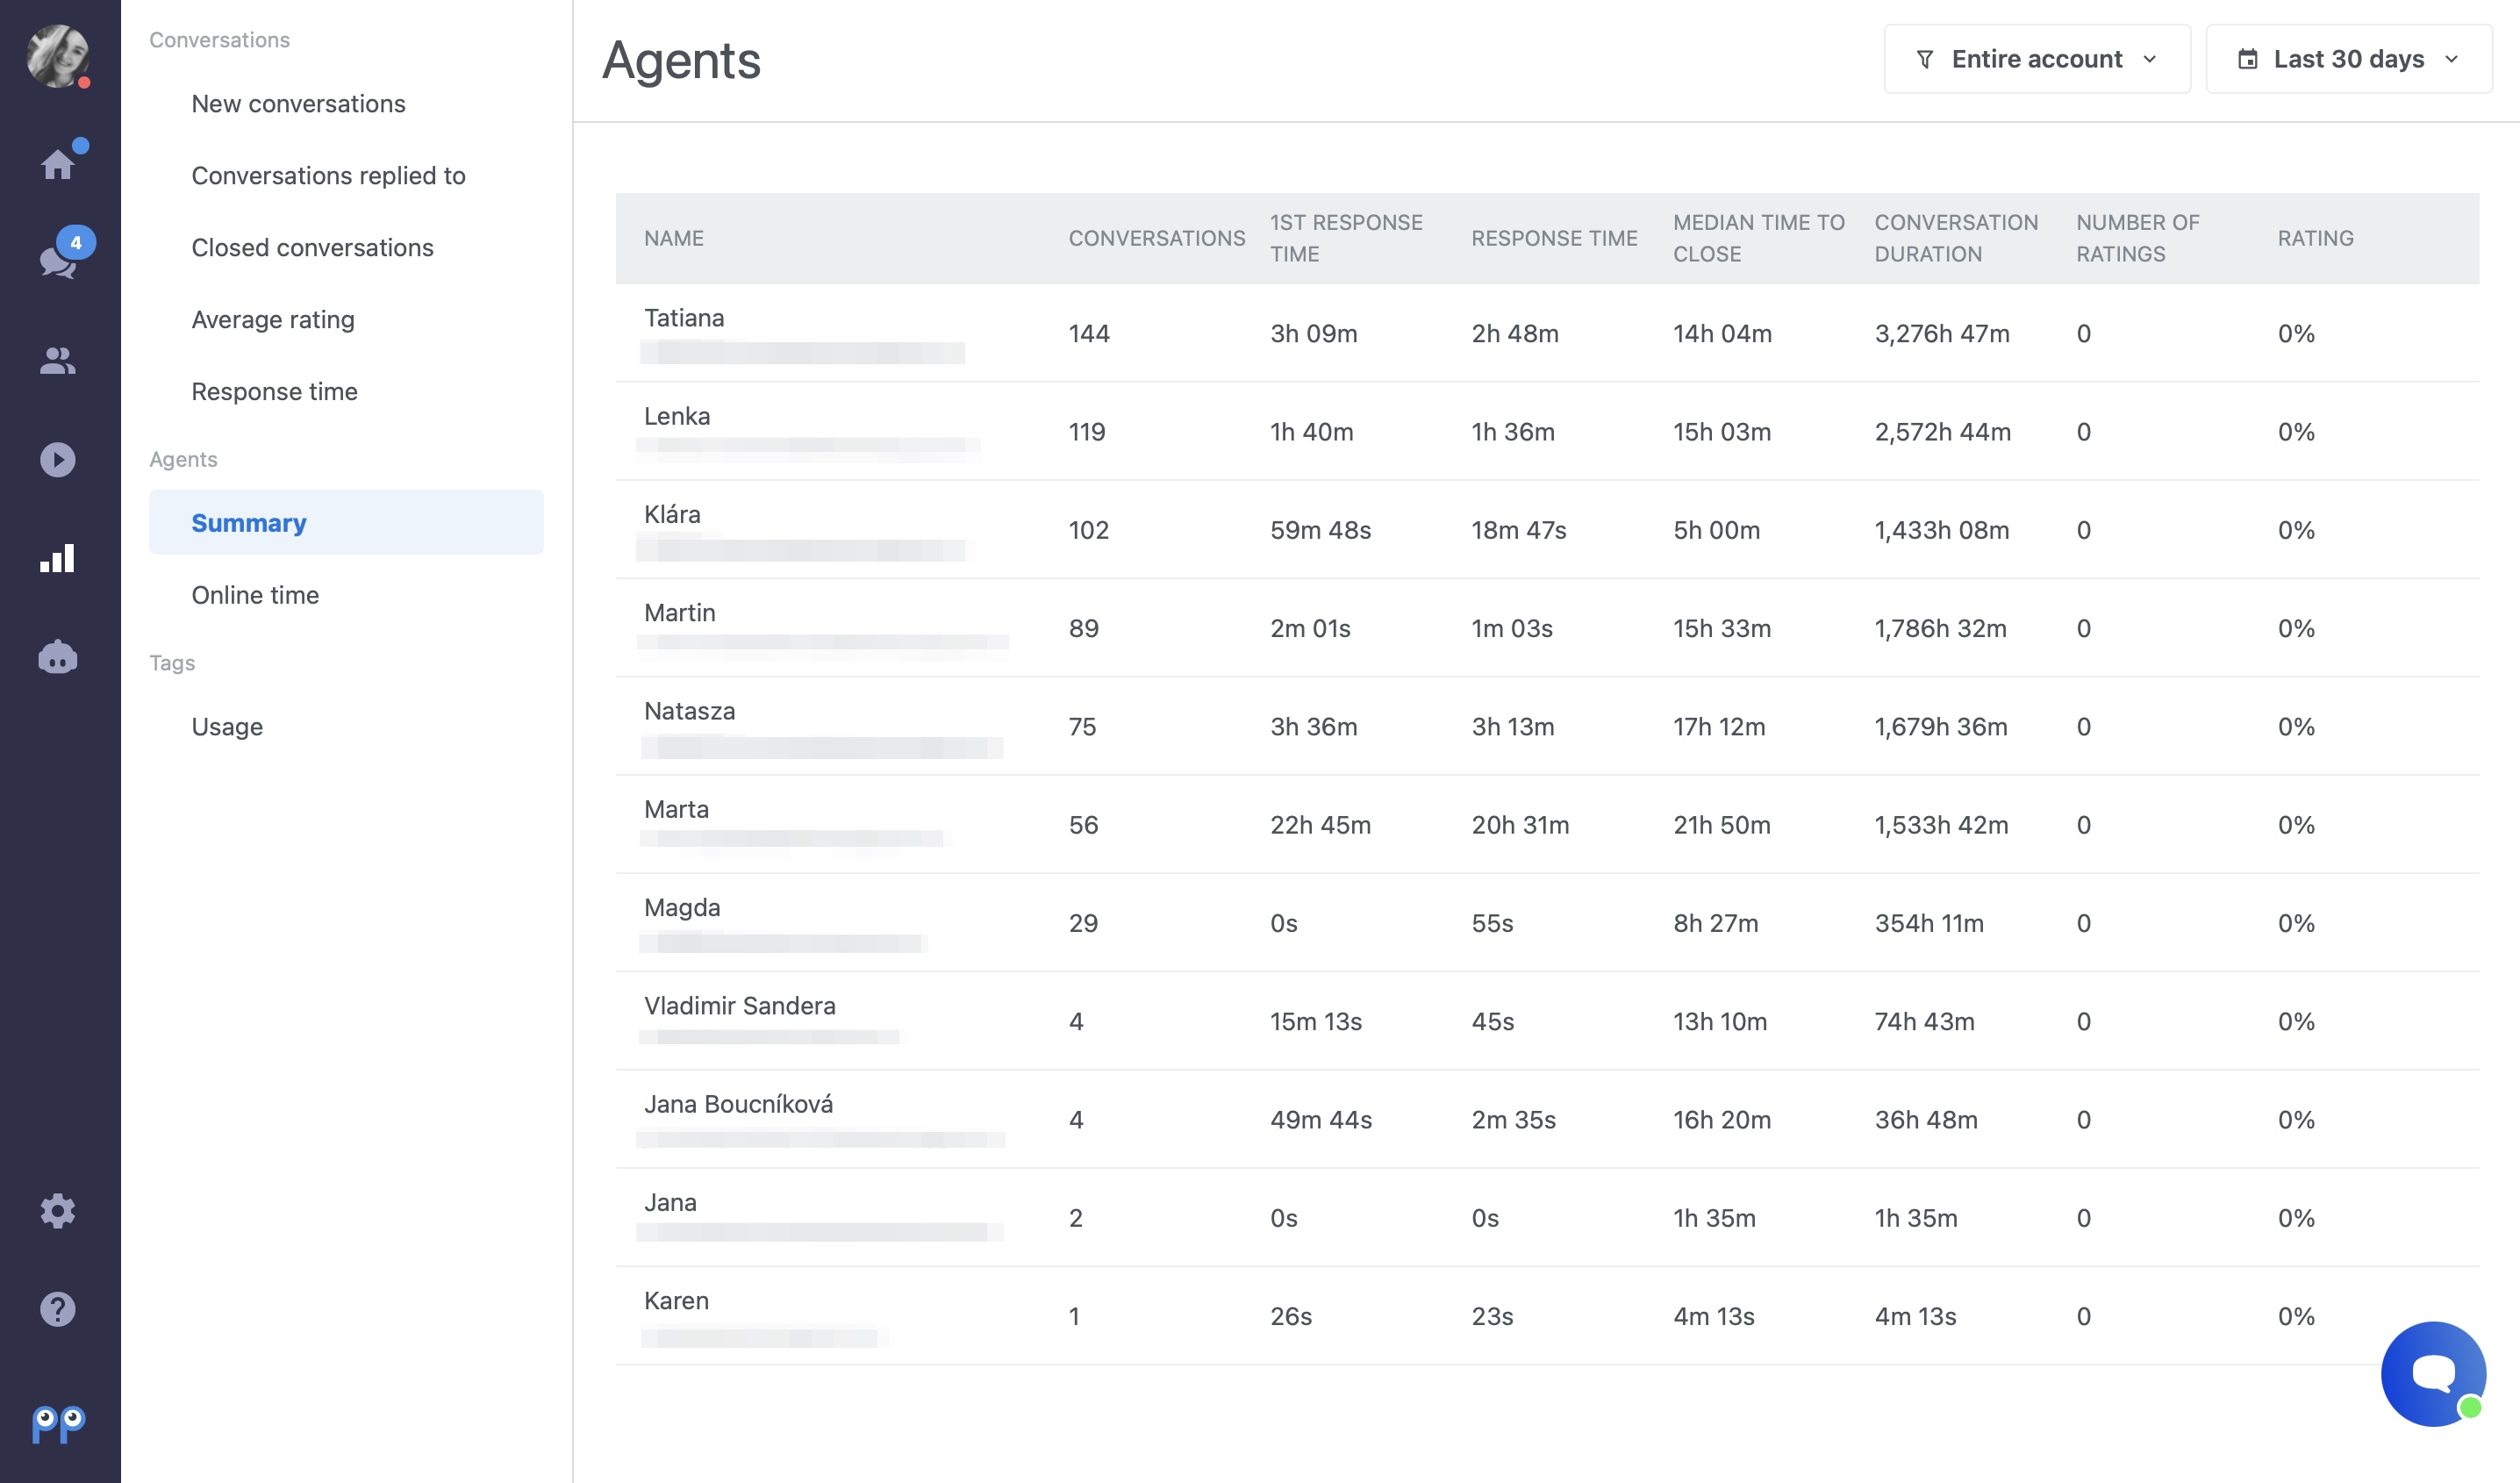
Overview
This feature is available only in the EXPERT package (Legacy: PRO).
Here you will find an overview of statistics for all operators in your account. If you have operators divided into groups, you can filter statistics by the group of your choice.
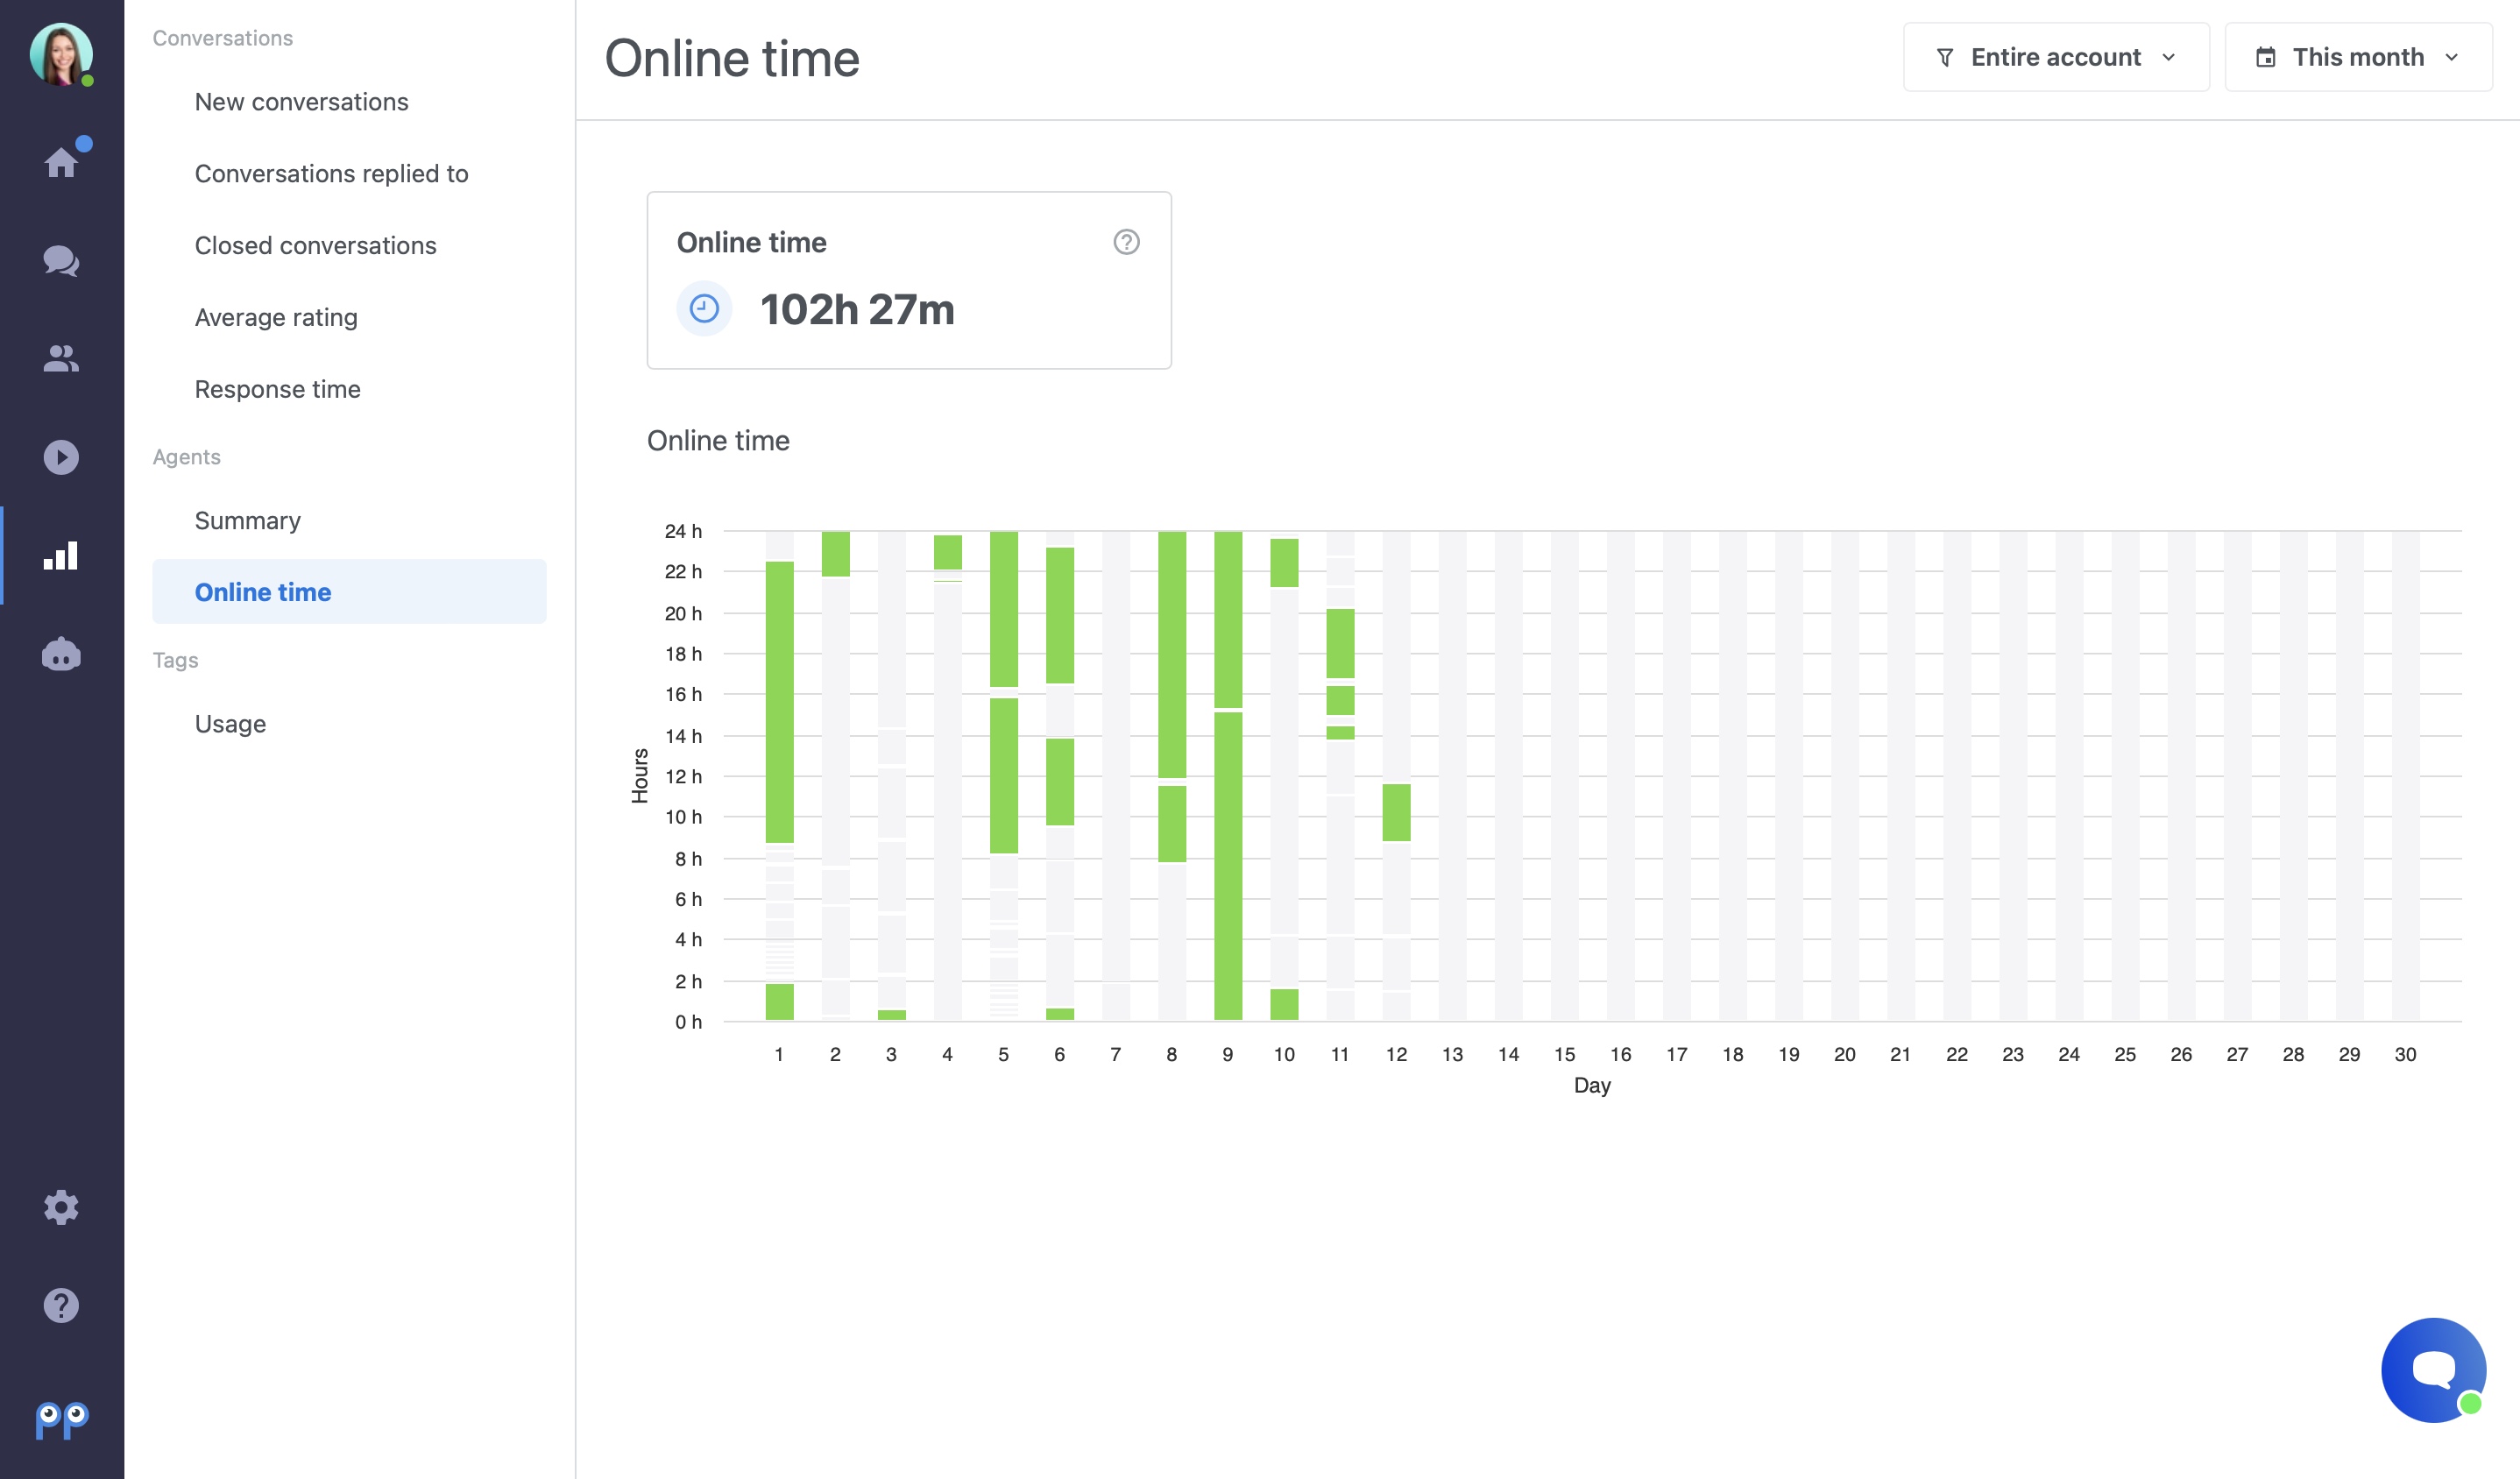
Online time
Use this part of statistics if you want to know during which hours your chat box was active (i.e. when at least one of the operators was online). In the upper right part of the page, you can again select a specific group whose online time you are interested in.
You can use this statistic, for example, as a manager overseeing your team. It is especially useful when operators work remotely.
Tag statistics
In the last section of statistics, you will find an overview of tag usage. What you can find in these statistics is described in this tutorial.
What is a median and what is it used for?
The median is the middle value for a data set that has been arranged by size. The middle value is less affected by extreme values and skewed data. This is why we use it at Smartsupp for calculating response time and chat duration.
Calculation
This is the first response time of one operator. The median is calculated as the "middle" value from data that has been arranged by size. In this case, the median is 18 seconds (the fifth largest and also the fifth smallest number in this data set).
Chat number | 1 | 2 | 3 | 4 | 5 | 6 | 7 | 8 | 9 | Median |
Response time (seconds) | 10 | 12 | 13 | 14 | 18 | 20 | 22 | 46 | 70 | 18 |