Interested in how your chatbot is performing? We've released new statistics that will help you better understand how the visitors interact with your bot.
Overall statistics
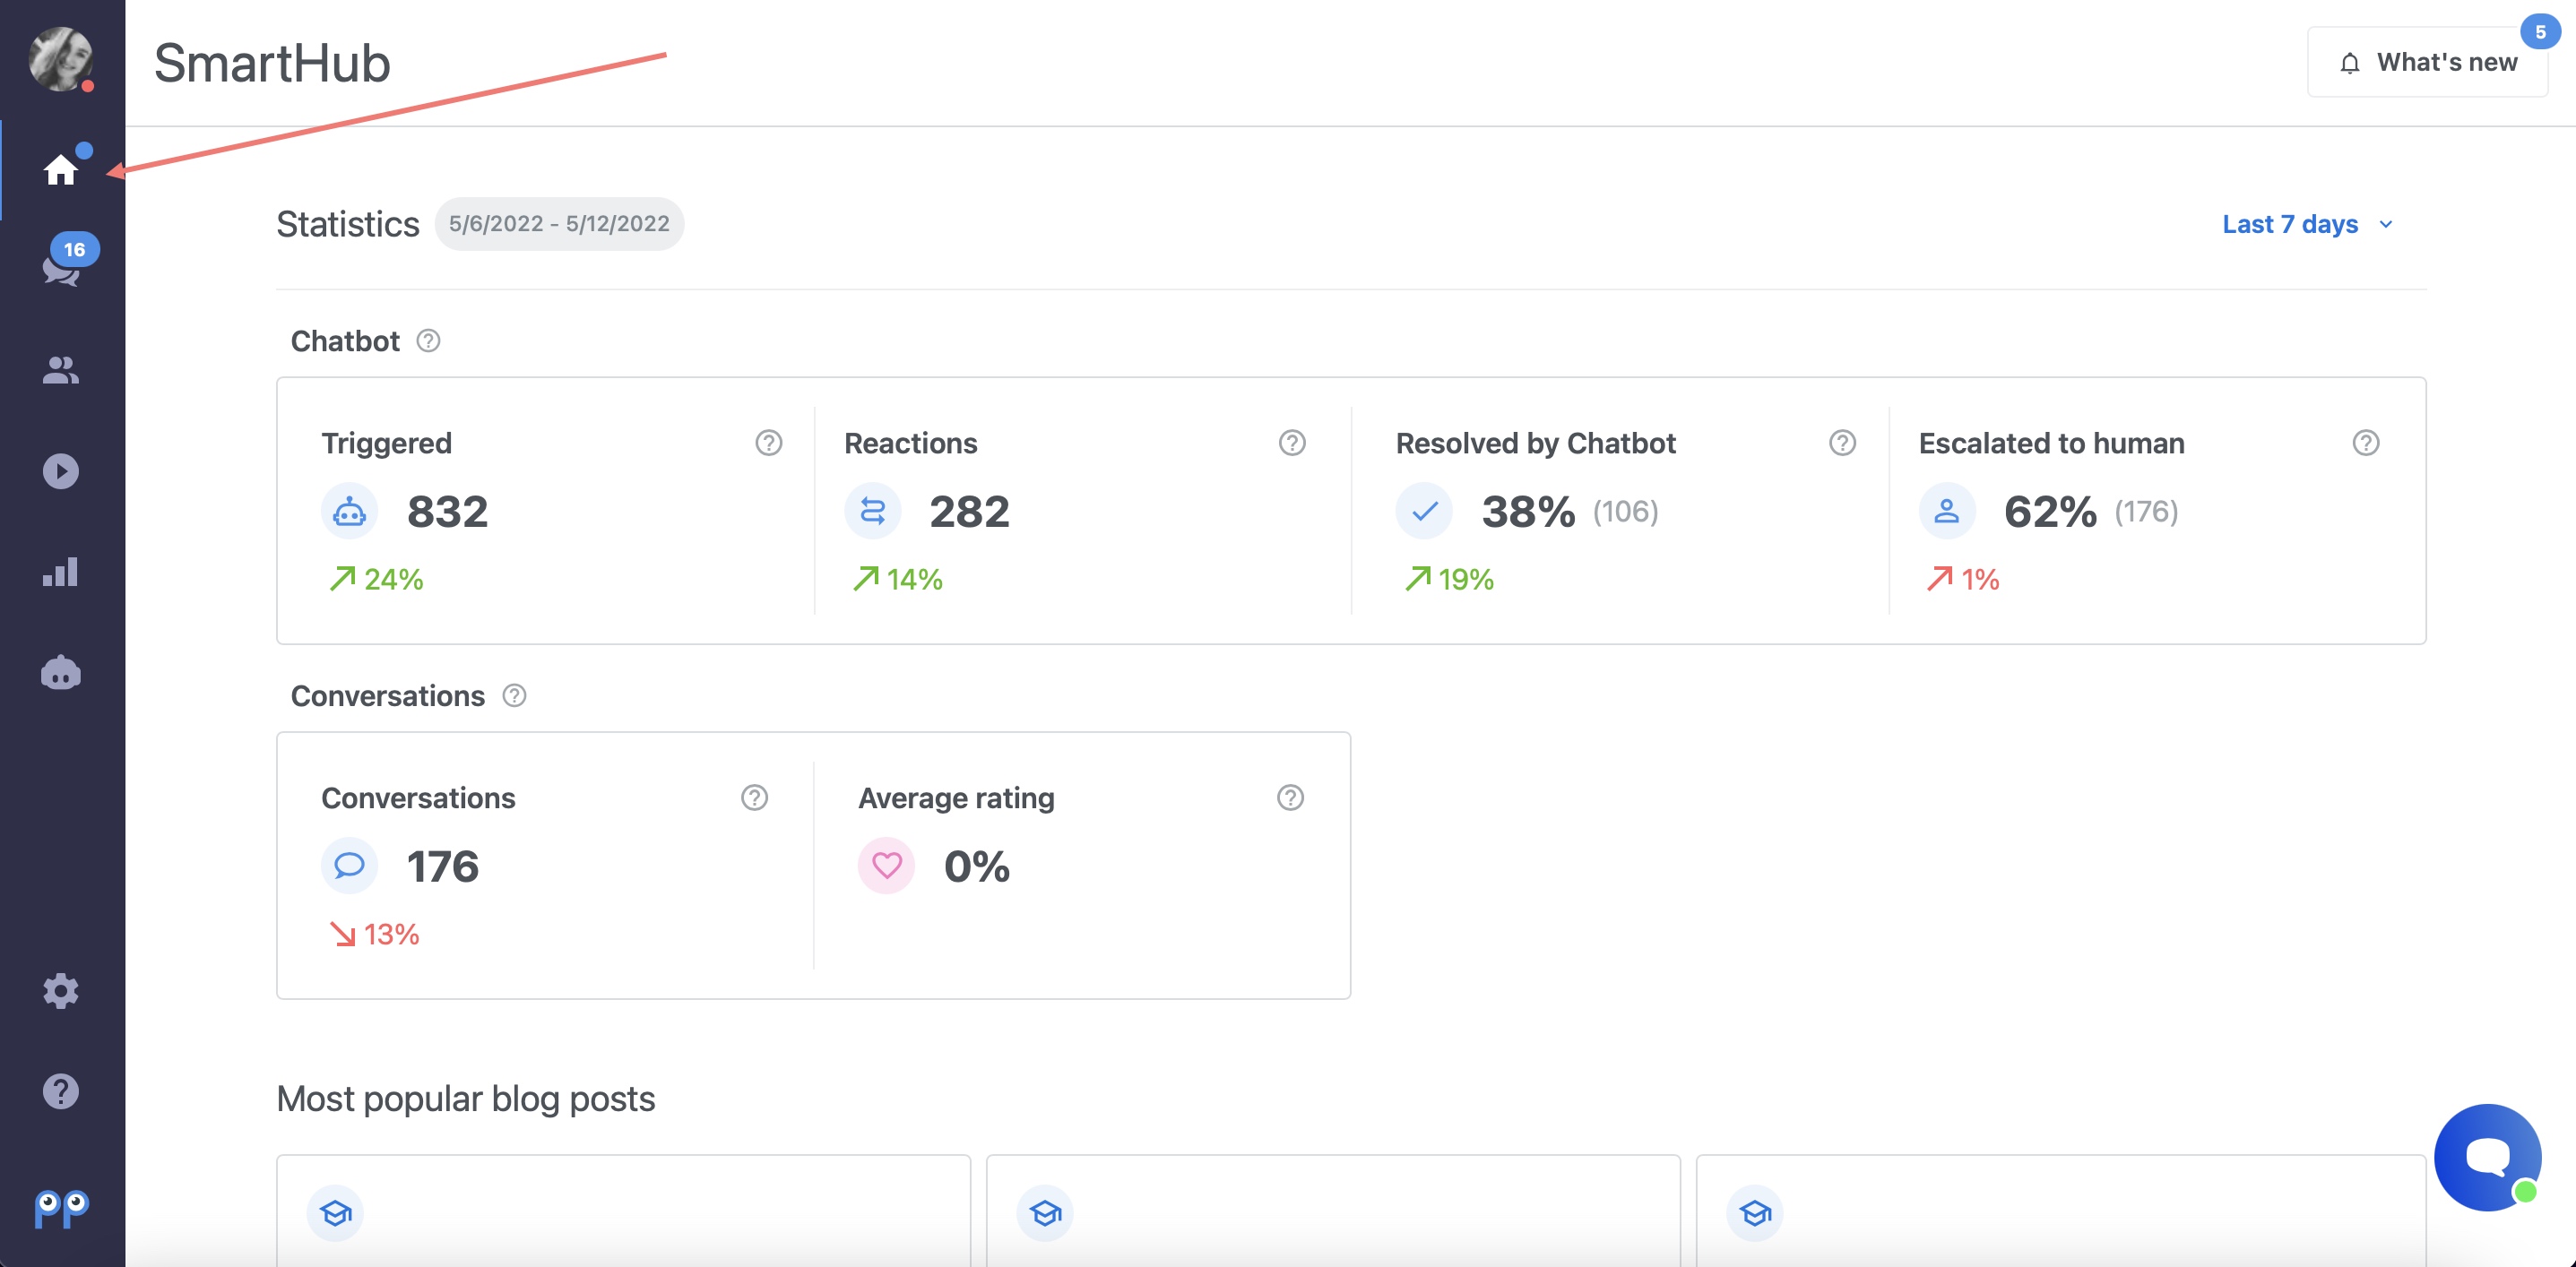
You can see the chatbot statistics directly in the SmartHub or in the chatbot settings.
What type of data can I see?
Wondering what exactly do the numbers mean? Let's go through it together.
- Triggered - this box shows the number of visitors to whom the chatbot was displayed.
- Reactions - this box shows the number of visitors that sent you a message via the chat box or clicked at least on one of the buttons as a reaction to the chatbot being displayed in the chat box
- Resolved by a chatbot - this box shows the number of visitors that interacted only with the chatbot which means that they have clicked on at least one of the chatbot buttons but did not send any message.
- Escalated to human - this box shows the number of visitors that sent a message via chat box as a reaction to the chatbot being displayed in the chat box. They may, or may not have clicked on one of the chatbot’s buttons.
It's also worth remembering that:
- The numbers in the boxes are always rounded off.
- Even if visitors browse through several pages on your website, it is always counted as 1 trigger.
- The same goes for chatbot buttons. Even if the visitor clicks on multiple buttons in the chatbot, it is always counted as 1 reaction.
- The statistics of deleted chatbots are still visible in the summary.
Are there any situations when the chatbot is NOT counted in the statistics?
- If you open the chatbot preview in the chatbot builder it is not counted in the statistics.
- If the chat box is hidden using the API, the chatbot is not triggered which means that it's not counted in the statistics.
Can I check the statistics for different time periods?
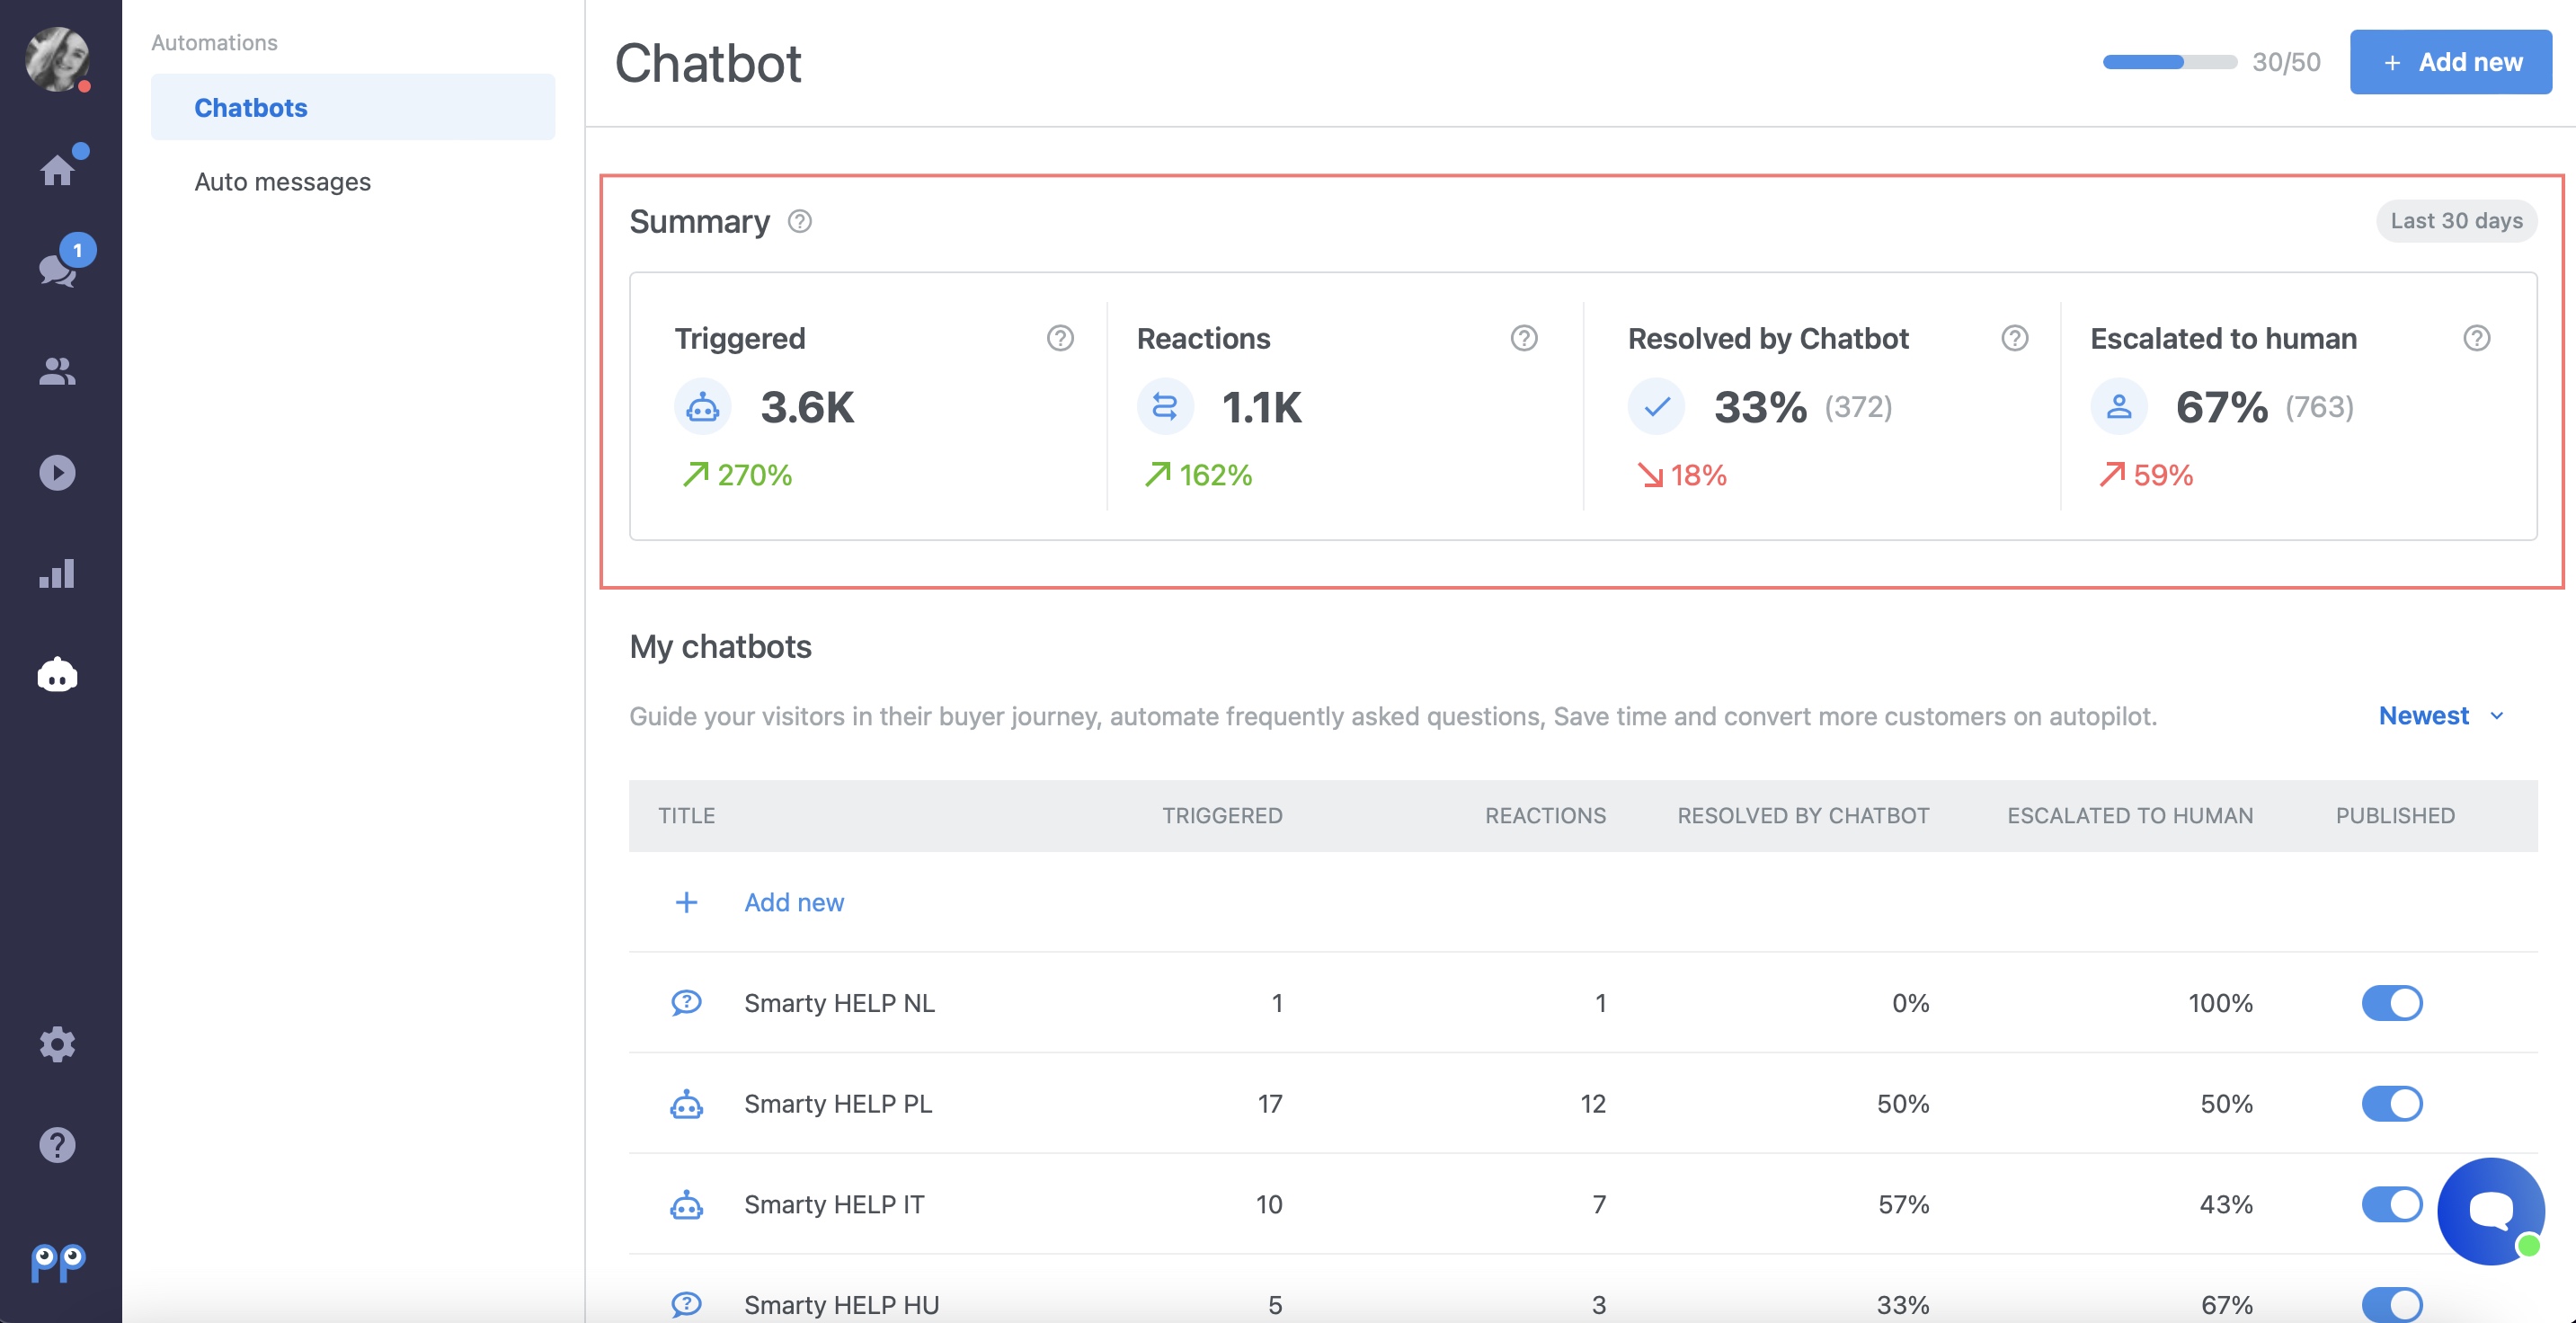
Yes. In SmartHub you can also try different time filters. This means that you can check the statistics for the last 7 days, 30 days, or 12 months. In the chatbot garage, the statistics are always displayed for the last 30 days.
Note: The data for chatbot statistics are not updated instantly, they are refreshed approximately every hour. In SmartHub and the Chatbot garage, you can see the time of the last update in the tooltip next to the title.
What are the green and red numbers in the boxes?
Not sure what exactly the green and red numbers in the boxes mean? We call these numbers TRENDS and they show you how the number of triggers or reactions has changed compared to the previous time period. The green color signifies a positive trend and the red color negative trend.
We'll show you an example: If the number of chatbot reactions in the previous time period is 10 but in this time period it's only 5, you'll see a negative trend of -50%.
If the data is not available for some reason then the trend is not displayed.

Note: For Escalated to Human statistics the trend is reversed - the arrow pointing up is red and the arrow pointing down is green. Because in this case, the positive trend means that the number of chats escalated to humans (agents) was lower. In other words, the chatbot resolved more conversations and agents had less work.
Detailed statistics
Thanks to the detailed chatbot statistics you'll be able to evaluate, how your chatbot is performing, on which chatbot buttons are visitors clicking the most, which subjects interest your customers the most, and if the chatbot answers are understandable a complete or if the customer needed to contact your customer support even after receiving an answer in the chatbot. This allows you to easily improve and modify your chatbot. Thanks to that your visitors won't have to contact customer support via live chat and will be able to find all the needed information there.
Where to find the detailed statistics?
If you want to check the detailed statistics of the chatbot, go to the Chatbot settings and click on the selected chatbot.
 Then click on Statistics in the upper menu. After this, you'll be able to see the chatbot statistics in the right panel.
What can I find in the detailed statistics?
In the detailed statistics you can check:
- Overall statistics of the chatbot

- Chart with statistics for the entire chatbot, with the information on how many times the chatbot was triggered each day and how many reactions the chatbot got (how many visitors opened and clicked on the chatbot).

- Usage of the particular chatbot buttons (first picture), which are also connected to the chatbot builder, so there is no need to search for the button, but you can easily update the answer in case of any improvement ideas. (second picture)


- How many of them contacted customer support after clicking on the particular button.
